How South Africa became a mining country again
· Citizen
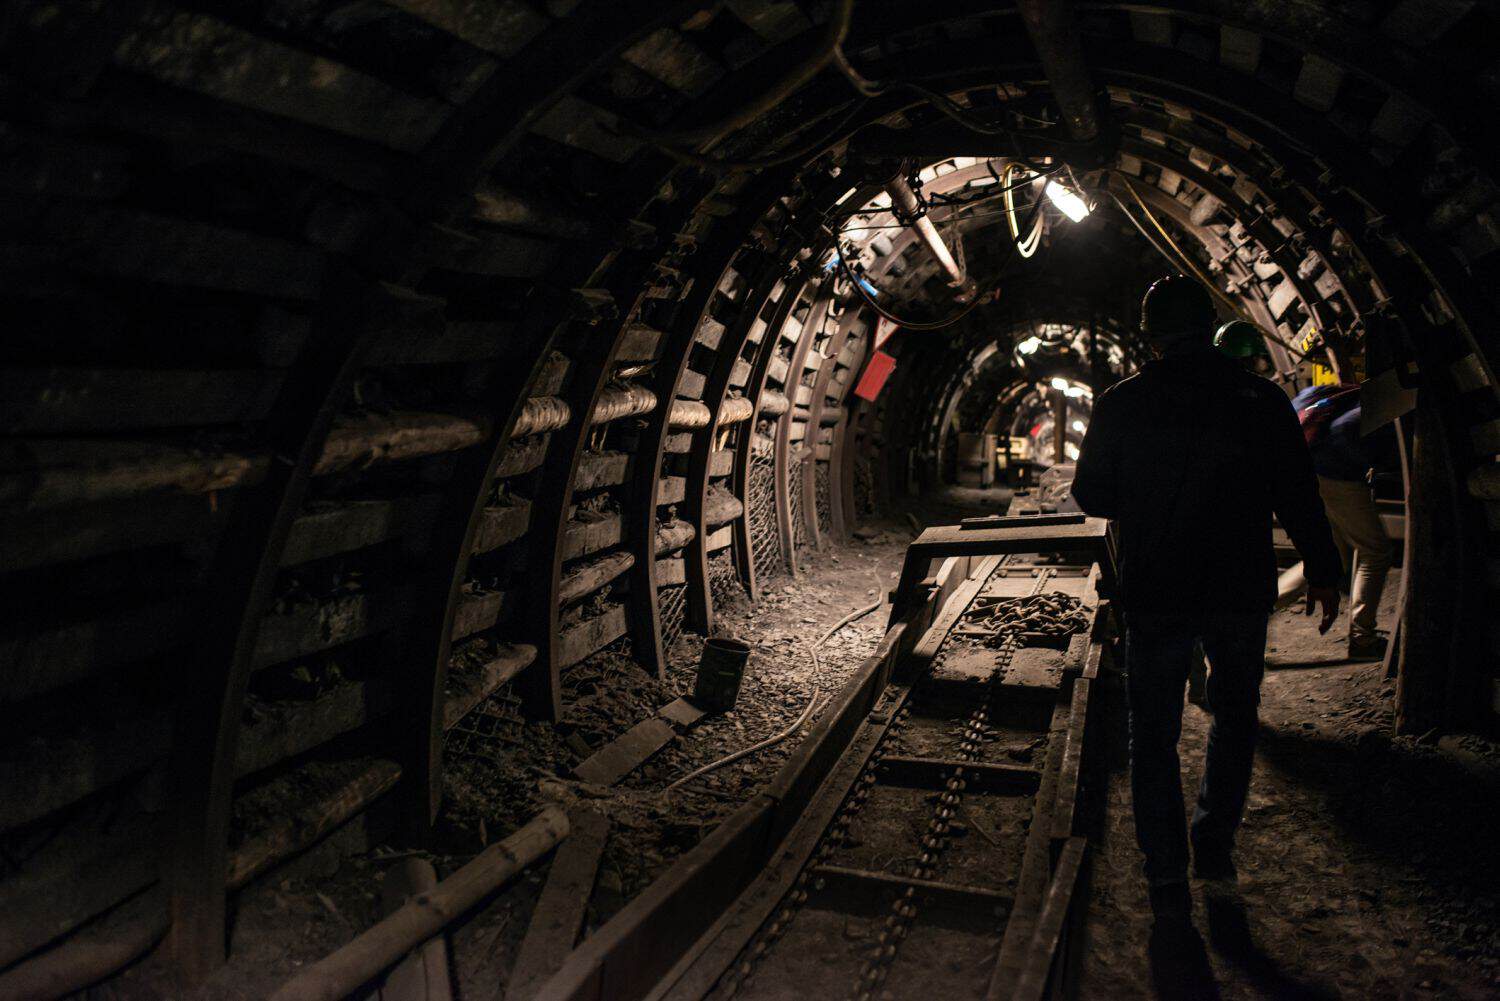
South Africa’s mining sector has come roaring back after years in the boondocks.
That resurgence has not been without some violent reversals.
Visit livefromquarantine.club for more information.
Mining shares were hammered on Monday, with Harmony falling 5.6%, Implats 3.7% and Valterra 3.1%, as the JSE All Share index (Alsi) lost 1.4% – a reminder of just how volatile the precious metals trade remains.
That doesn’t undo the longer term trend, with resources now accounting for more than 30% of the JSE Alsi, up from a pitiable 10% in 2015 at the low point of the commodities cycle.
This means mining’s weighting has more than tripled from the lows of a decade ago.
That’s almost entirely due to rising commodity prices, particularly gold and platinum group metals (PGMs), which now account for four of the 10 largest companies on the JSE, according to a recent analysis by valuations company Multiples.
Gold Fields, valued at $43 billion, is SA’s largest company in terms of market cap. This puts it ahead of Naspers at $35 billion, Impala Platinum at $14 billion and Harmony Gold at $13 billion.
The JSE was once overwhelmingly a mining market, with resources accounting for 85% of the Alsi in 1960.
Their dominance gradually faded as the economy and stock market diversified into banking, industrial and consumer companies.
Mining’s decline accelerated as SA’s ageing deep-level gold mines became progressively more expensive to operate, while the country’s mining houses expanded offshore following the lifting of international sanctions in the 1990s.
By 2015 resources had dwindled to less than 10% of the Alsi.
Top 10 most valuable companies on the JSE
RankCompanyMarket cap Sep 2026Sector1Gold Fields$43bnGold2Naspers$35bnTech/media3FirstRand$34bnBanking4Capitec$34bnBanking5Standard Bank$33bnBanking6MTN$23bnTelecoms7Valterra Platinum$23bnPGMs8Vodacom$18bnTelecoms9Impala Platinum$14bnPGMs10Harmony Gold$13bnGoldSource: Multiples (7 September 2026); AngloGold Ashanti excluded as it no longer has mining operations in SA.Harmony Gold
Harmony’s transformation has been particularly dramatic.
Its market value was just $4 billion at the end of 2023. It is now around $13 billion. The company’s market cap rose 30% in 2024 and another 163% in 2025.
It hasn’t suddenly become a much larger gold producer – in fact, its 2026 gold production of 1.43 million ounces was 3% lower than the previous year. What has changed is the value of the ounces it produces and its transformation into a gold-and-copper company.
Harmony is producing roughly the same amount of gold as three years ago, but the spread between the received gold price and all-in sustaining costs (AISC) has gone from $250 to more than $1 600 an ounce.
Impala Platinum
Impala Platinum’s inclusion in the top 10 is one of the clearest examples of how the PGM price recovery has transformed miners’ fortunes, with its dollar revenue rising 44% per ounce recovered.
That windfall is reflected in free cash flow ballooning from R639 million to R7 billion for the first half of the 2026 financial year.
There’s also the issue of a structural PGM supply shortfall which investors clearly believe is more than a cyclical anomaly.
Valterra
Valterra’s numbers are even more extraordinary given its near doubling in revenue to R82 billion in the first half of 2026 and its five-fold increase in adjusted Ebitda (earnings before interest, tax, depreciation and amortisation).
Higher PGM prices explain a large part of this increase, but operational improvements – including a 21% drop in all-in sustaining costs and the 18% increase in sales – magnified the figures.
Changing face of the top 10
What’s equally interesting about the table above is that banks account for three of the top 10 companies, and technology and telecoms the balance.
The changing composition of the top 10 reflects a broader reshaping of the JSE. Last year, Allan Gray calculated that gold miners had increased their weighting in the Alsi by 1 300% over the past decade.
This while the weighting of the large multinational companies that once dominated the index has shrunk from about 30% to just 7%.
Gold Fields was the standout performer over three years. Its share price has more than tripled since 2023 as it posted a 141% increase in realised gold prices against a 46% increase in all-in sustaining costs.
The happy convergence of increasing profits per ounce sold and rising production (up 11.5% in the first half of 2026) helped push its share price to record levels in 2026.
The resurgence of mining companies in the Top 10 list over the past three years is in part due to soaring precious metals prices, with gold more than doubling from $1 900 an ounce in 2023 to $4 312/oz.
This is not unique to Gold Fields.
Ninety One estimates that at current prices gold miners’ margins are four to five times higher than they were in 2024.
Osa Mazwai, investment strategist at Investec Wealth & Investment International, notes in a recent podcast that commodity cycles tend to lead the economic cycle in South Africa.
Data from Minerals Council SA shows year-to-date mineral sales exceeding R242 billion, up 39% on the equivalent 2025 period, with PGM sales up 113.5% and gold 51.7%.
The recovery in PGM shares is being underpinned by an unusually tight platinum market.
The World Platinum Investment Council expects platinum supply deficits to average 689 000 ounces annually between 2026 and 2029, equivalent to about 9% of annual demand.
Will the party last?
There’s certainly grounds for celebration, but with a caution: the SA gold mining sector remains in structural decline, with gold output declining at an average 5.8% a year since 1994, from 580 tonnes to less than 90 tonnes currently.
The PGM industry has its own structural issues, following years of throttled capex and bare bones resource development. The extraordinary return of precious-metals miners to the upper reaches of the JSE does not mean the structural problems confronting SA mining have disappeared.
The years of underinvestment have, ironically, contributed to the supply deficit that is now driving PGM prices higher.
Harmony has witnessed this trend first hand, paying about $1 billion for Australia’s MAC Copper, owner of the CSA copper mine, while management says its strategy includes “disciplined, value-accretive mergers and acquisitions”.
Higher profits have restocked miners’ war chests for future expansion.
The scramble is now on for high quality assets across the globe, and a recent PwC report says we should expect intensified M&A activity in the coming months and into 2027. These are more likely to be bolt-on acquisitions and consolidations than major mergers – the danger being that the commodity boom has driven up the price of potential targets.
Mining history provides plenty of examples of companies using the windfall from one commodity boom to overpay for assets near the top of the cycle.
This article was republished from Moneyweb. Read the original here.